
How I Use TrainingPeaks Metrics to Coach Runners to Their Best
Run Strong Coaching | Guiding | Strength and Conditioning
Understanding Training Peaks Metrics
Imagine being at your starting line, energized, recovered, and confident you’ve nailed your preparation. As your coach, that’s the goal I chase—and it all starts with decoding the heartbeat of your training: TSS, CTL, ATL & TSB.
These four metrics, seen through your Performance Management Chart (PMC), become the foundation of a truly intelligent training plan. In this post, I’ll explain each, show how they work together, and share coach techniques to help you hit your best.
- TSS
- CTL
- ATL
- TSB
🧮 Deep Dive — Training Stress Score (TSS)
What it is
TSS measures the stress of each session by blending duration and intensity—running’s take on it is rTSS. It uses Normalized Graded Pace and your threshold pace.
How it’s calculated
Using this formula:
TSS = time × IF² × 100
Where IF (Intensity Factor) = normalized pace ÷ threshold pace. A one-hour threshold run typically scores ~100 TSS.
Why it matters
It allows objective comparison between sessions—tempo, intervals, and long runs alike.
Coach Tip:
To prevent overload, limit weekly TSS increases to 10–15%, keeping CTL gains at a sustainable 5–7 points/week.
📈 Deep Dive — Chronic Training Load (CTL)
What it is
CTL, or “fitness,” is the exponentially weighted 42-day average of daily TSS. It captures your long-term training load.
How it’s calculated
CTL_today = CTL_yesterday + (TSS_today – CTL_yesterday)/42
Why it matters
It tells you whether you’re effectively building endurance. A steady CTL rise (~5–7 points/week) suggests meaningful progress; sudden spikes, however, risk injury.
Coach Tip:
Track your CTL slope in TrainingPeaks. If it stalls, trigger a recovery week or adjust load.
⚡ Deep Dive — Acute Training Load (ATL)
What it is
ATL measures your short-term fatigue via a 7-day rolling TSS average. It fluctuates quickly with hard efforts or recovery.
How it’s calculated
ATL_today = ATL_yesterday + (TSS_today – ATL_yesterday)/7
Why it matters
It shows how your body is responding now—it catches spikes in fatigue early.
Coach Tip:
If ATL exceeds CTL by 5–10, it’s time for recovery-focused days or easy runs.
⚖️ Deep Dive — Training Stress Balance (TSB)
What it is
TSB = CTL − ATL. It reflects your form—the fine line between being fit and being fatigued.
Why it matters
TSB +5 to +15: Fresh, race-ready
TSB negative (–20 to –30+): Heavily fatigued during development blocks
Coach Tip:
Taper into a TSB range of +5 to +15 in the final 7–10 days before your A-race to peak on the day.
Online running Coach and Personal Trainer
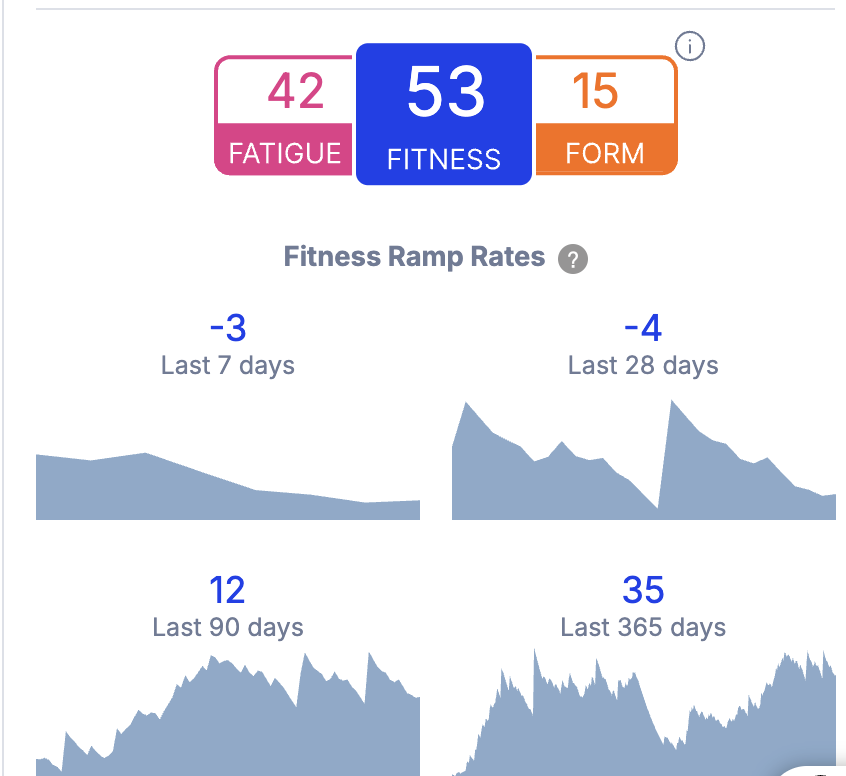
📊 How These Metrics Show Up on a Performance Management Chart (PMC)
The PMC overlays TSS, CTL, ATL, and TSB so you can see the full picture
Example scenario:
CTL steadily rising through base
ATL jumps during hard blocks
TSB swings negative before taper
TSB finally climbs +10 just in time for race day
Coach Tip: Ask athletes to share PMC screenshots—then we annotate where to dial intensity, add recovery, or peak.
| Metric: |
|---|
TSS
CTL
ATL
TSB
| Refers To: |
|---|
Session stress
Long-term fitness
Short-term fatigue
Readiness/form
| Coach Strategy: |
|---|
Increase gradually (10–15%/week)
Build at 5–7 points/week
Recover when ATL >> CTL
Taper into +5 to +15 before race
🎯 Your Next Move
Interested in a bespoke TrainingPeaks running coaching tailored to your CTL, ATL, and TSB trends?
Book a free 30-minute coaching consultation and let’s craft your race-ready performance from data to finish line.